

Introducing enhanced Analytics: deeper reporting powered by Metabase

Knowing what happens on a kiosk matters as much as knowing what happens online. Retailers already track engagement, device uptime, and session data on Cloudshelf, but turning that into a clear, exportable report has always taken extra work. Cloudshelf's analytics have been rebuilt on Metabase, giving retailers a far wider set of visual, exportable charts alongside the stats they already rely on.
How the new analytics work
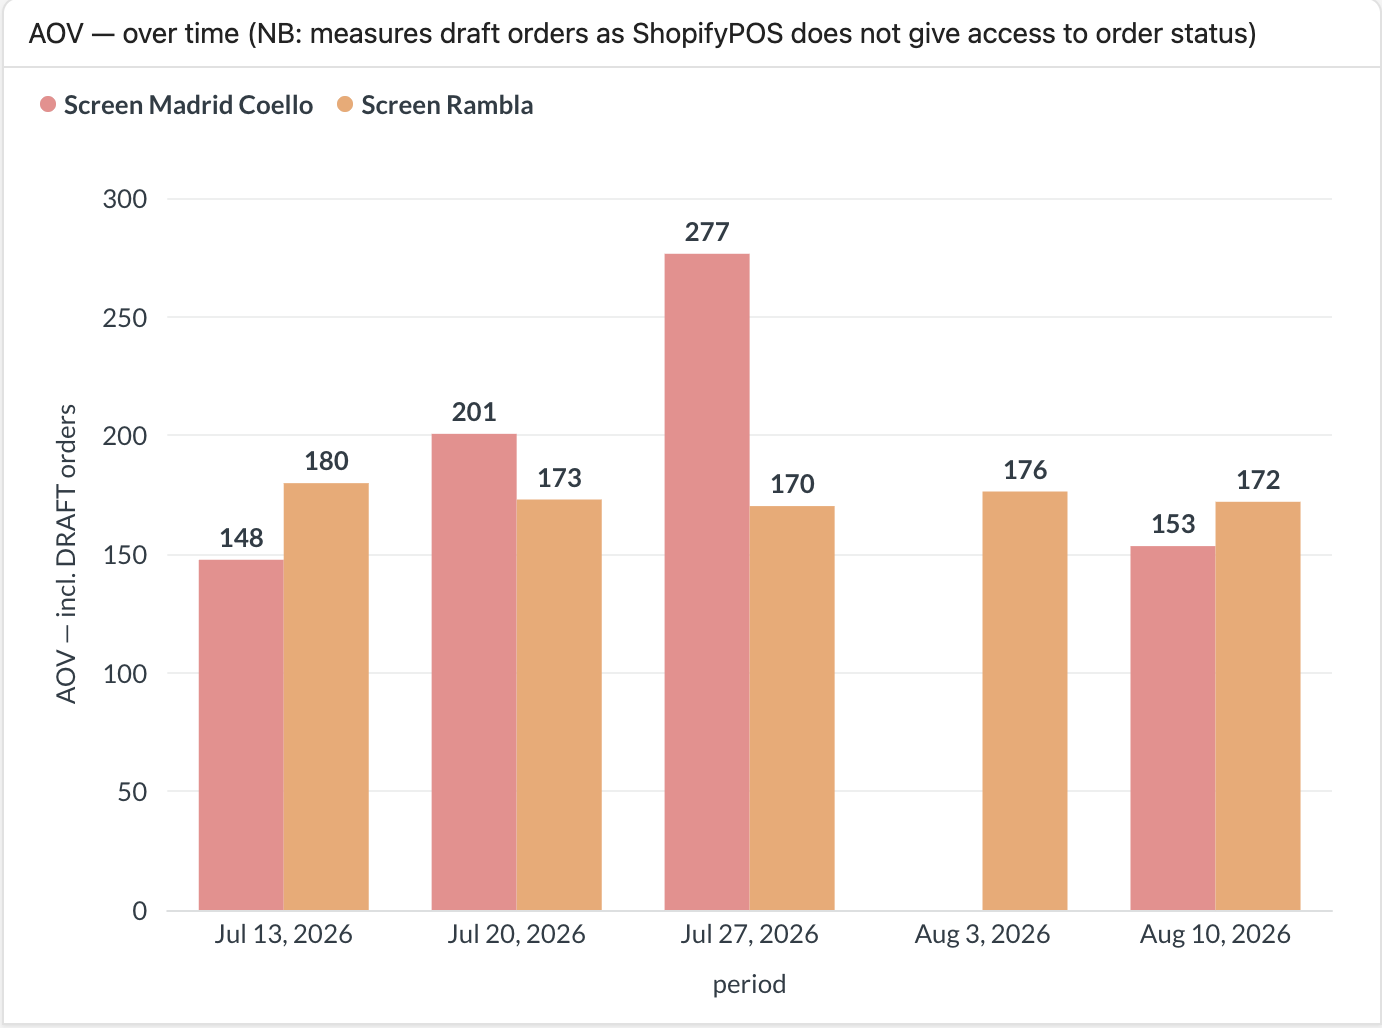
The new analytics suite adds a range of charts on top of existing engagement, uptime, and session data. Retailers can see clicks into their top ten products and top ten collections, showing what shoppers are drawn to on the kiosk. Bounce rate shows how many shoppers opened a Cloudshelf without building a basket. Average order value (AOV) tracks the value of completed baskets over time. Every chart can be filtered by location, device, Cloudshelf, or sales assistant. A single store, kiosk, or team member can be reviewed on its own.
Why this matters
Clear, visual data makes it easier to spot what is working and what needs attention. A retail manager can compare stores at a glance. A store manager can see how their own kiosks are performing without digging through raw numbers. Every chart can be downloaded, so the data feeds straight into the wider reports a retailer already builds for the business.
How to access it
The new analytics sit alongside the reporting retailers already use in Cloudshelf Manager, so there is nothing extra to set up. Store managers and retail managers can open their dashboards and filter by location, device, Cloudshelf, or sales assistant to get the picture they need.
Find out more
To find out more about Cloudshelf's analytics and reporting, or to enquire about how Cloudshelf can help you get a clearer picture of in-store performance, reach out to us at sales@cloudshelf.ai.